
24,004 lbs
Debris removed during RaaS
436,000
Water readings logged
315
Sites monitored or cleaned
2024
First Year On the water
Case study · Cleanup
City of Huntington Beach
Huntington Harbour · Orange County, CA · Rover as a Service
“It’s been really successful for us, especially in accessing areas that you simply wouldn’t be able to reach from the land side.”
17,585 lbs
Debris collected
172
Sites Cleaned
133
Hours of Services
Nov 2024
Services began
THE PROBLEM
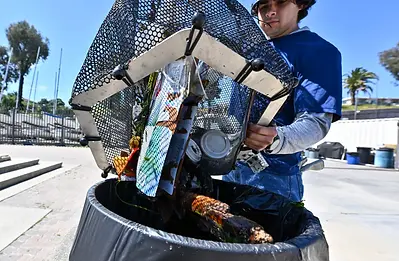
Floating trash collects in corners and pockets of Huntington Harbor, and residents notice. Many of those spots can't be reached from land because the shoreline is private property, and a crew boat can't get into dock slips or the narrow gaps between docks.
WHAT WE DID
The city chose Rover as a Service. Clean Earth Rovers deploys the Rover and collects the debris; city staff don't have to manage or run the equipment. Its size lets it work inside of slips, corners and gaps where the bulk of debris gathers.
WHAT CHANGED
The city reports better access to hard-to-reach areas, more debris captured and a more consistent cleanups that keep residents and visitors happy. The Rover now complements the harbor's existing maintenance rather than adding to it and addresses debris that was otherwise not being cleaned.
WHAT'S NEXT
DataPods are on their way to Huntington Beach. The city plans to share live readings with its Harbor Commission, the county's water quality monitoring program and the public. The city also plans to continue using the Rover as a Service for years to come.

Case study · Monitoring
Newport Beach Harbor Department
Newport Harbor · Orange County, CA · DataPods and DataHub
“Our investment in CER has netted great returns and our partnership with the organization is strong and productive.”
880 acres
Of harbor water
3
DataPods Deployed
154 sq mi
Of watershed draining into it
52,650
Datapoints captured annually
THE PROBLEM
Newport Harbor is the largest recreational harbor west of the Mississippi, and it sits at the bottom of a 154-square-mile urban watershed: a coffee cup dropped on a street in Yorba Linda ends up in the harbor. For decades the city relied on county water sampling once a week, which meant learning about a problem days after it started.
WHAT WE DID
The Harbor Department deployed DataPods across the harbor, with the second-generation units reporting in real time since August 2026. Readings appear on the DataHub dashboard as they arrive.
WHAT CHANGED
The department now has its own water quality record instead of waiting on the county. It uses the dashboards in presentations to its Harbor Commission and community groups, and has used the data to answer unsupported claims of poor water quality and poor harbor management.
WHAT'S NEXT
The department plans to monitor specific harbor projects before, during and after, to show their effect on the water, and to use Gilligan, DataHub's AI assistant, to help plan its next water quality improvements.
Southern California Ports
Working port · San Pedro, CA
Settlement-funded cleanup project
6,419 lbs
Debris collected
Old Woman Creek NERR
Freshwater estuary · Lake Erie, OH
DataPod tech validation with Cleveland Water Alliance
118,260
DataPoints Captured
Where it's working.
Each pin is a DataPod or Rover deployment, current or completed.

